Continued Growth of Global Feedstock Supply Supports SAF and RD
March 2026
Latest data on annual global feedstocks demonstrates availability to fill 23x California’s Renewable Diesel demand, and projected to grow. [1-2]
California total diesel demand is 3.5 billion gallons per year (as shown on the chart). Increasing SAF production by 200 million gallons (which is the 2035 SAF target) would not be a visible change on the chart.

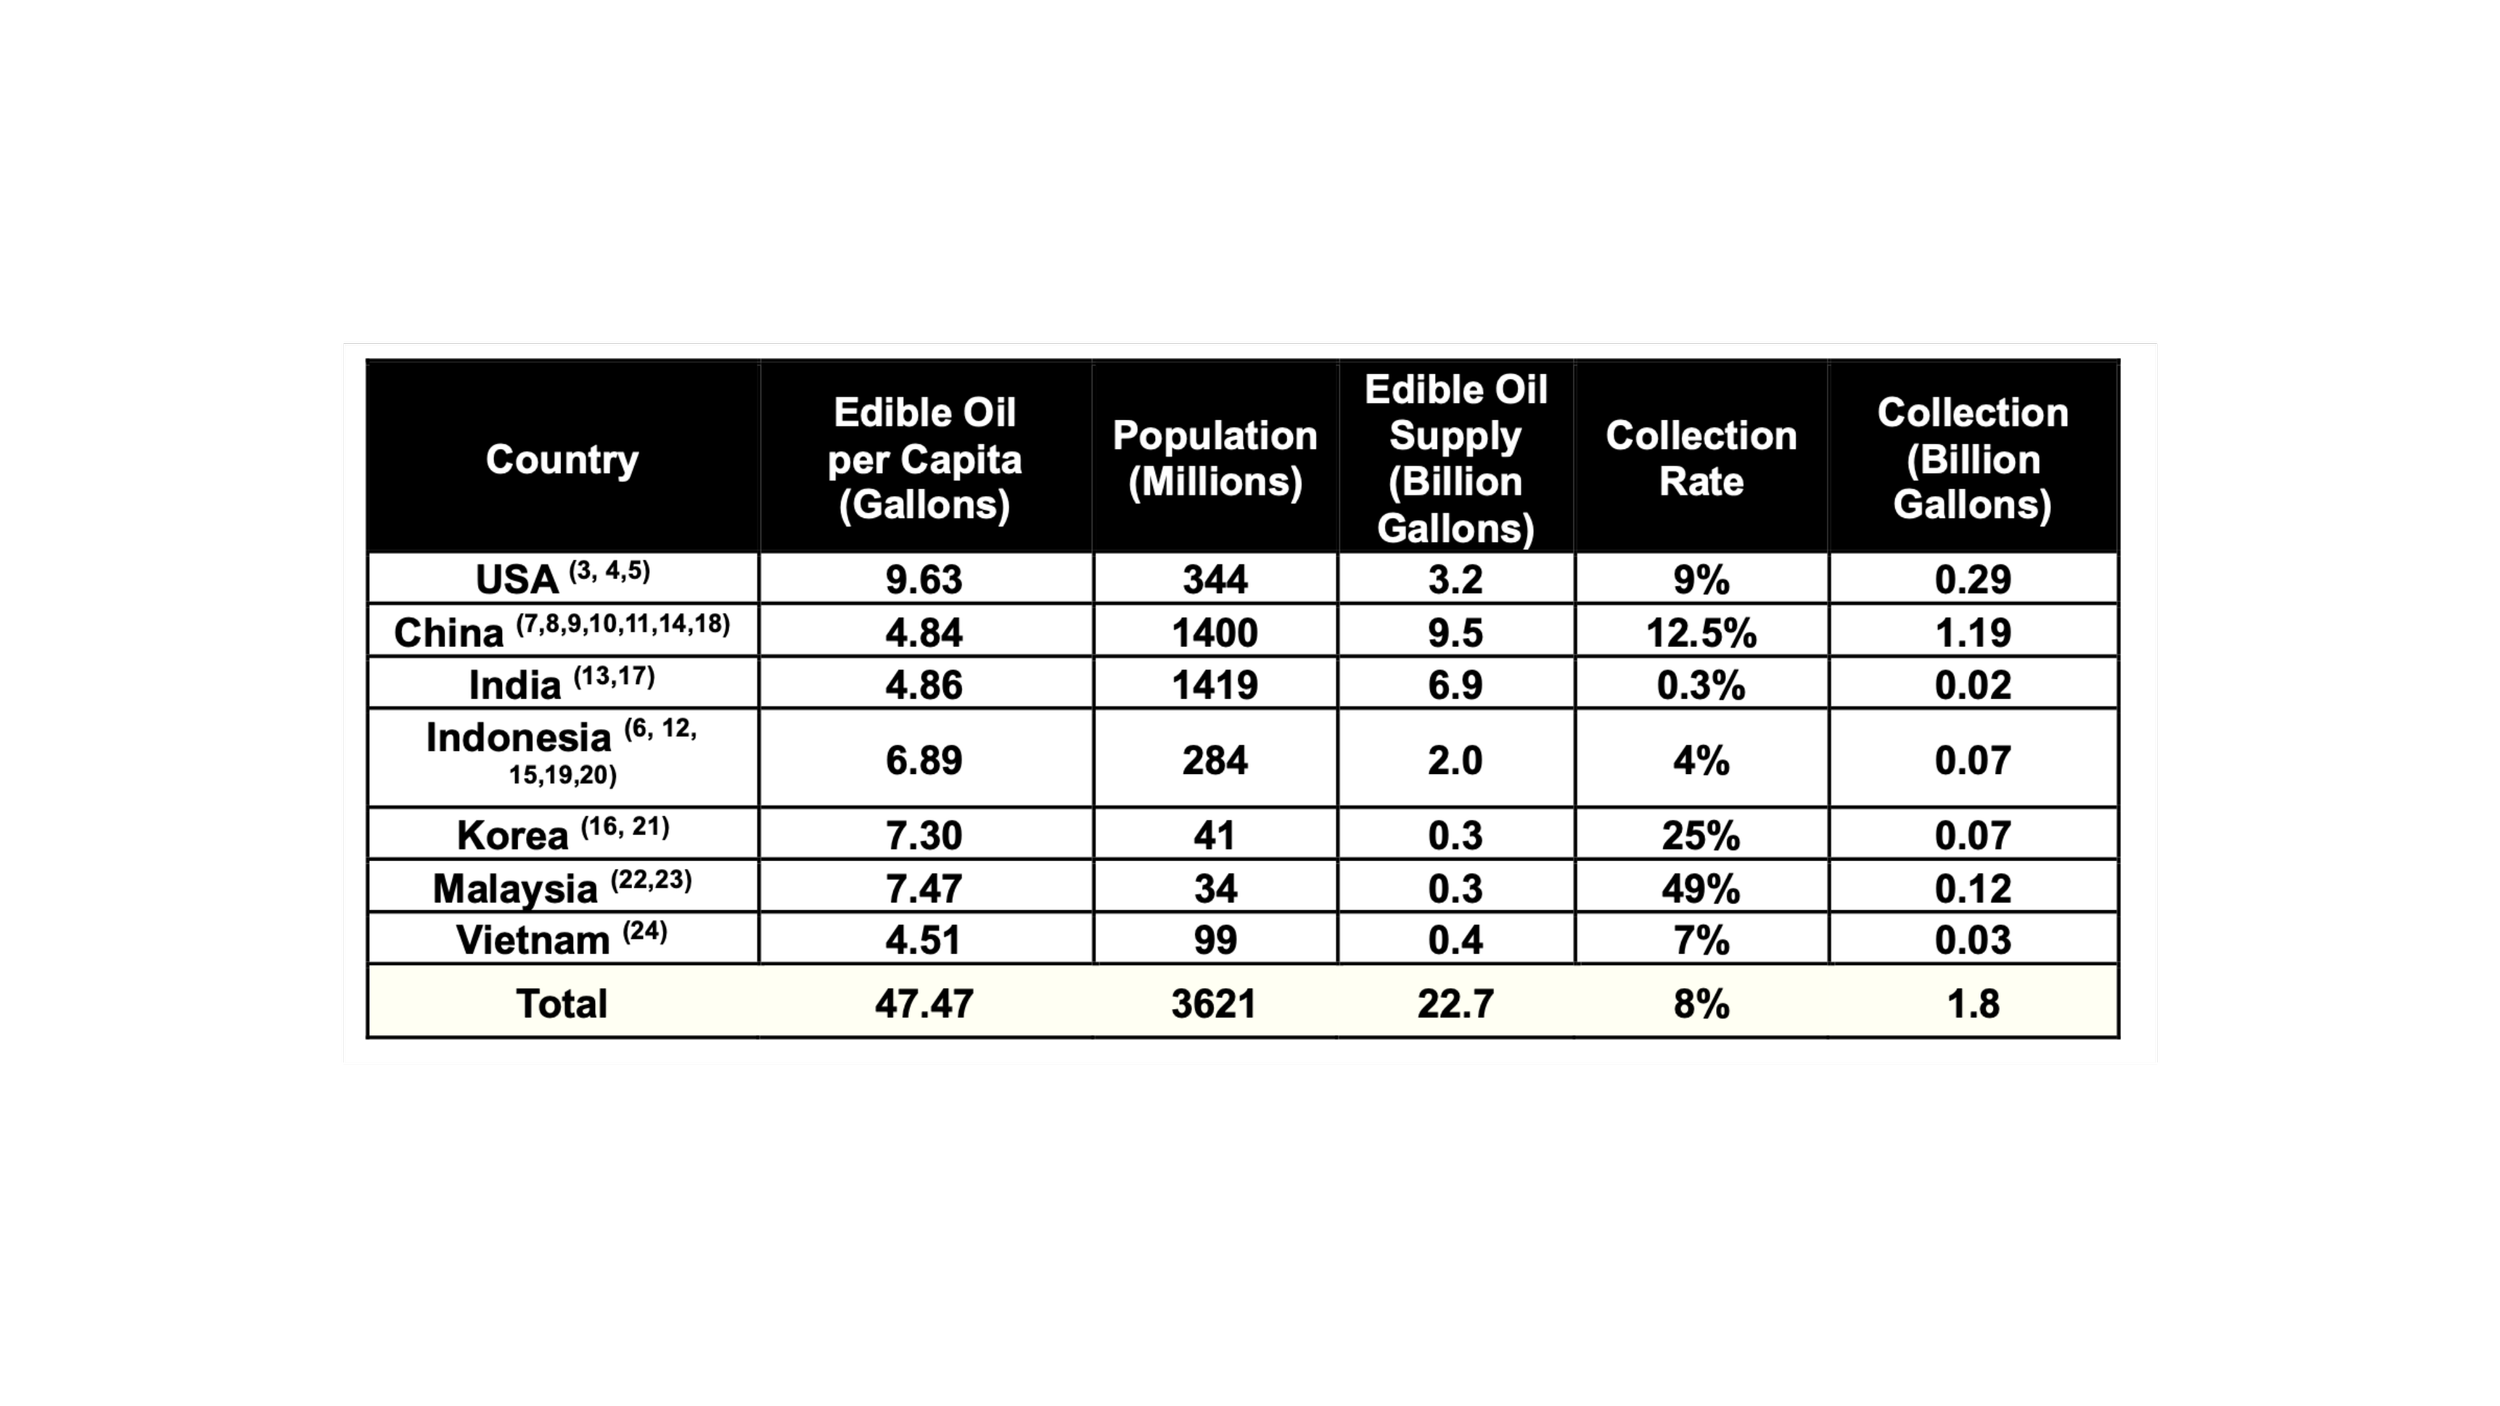
Used Cooking Oil (UCO) collection rates expected to increase
Significant Used Cooking Oil growth is expected to come from Used Cooking Oil, with overall collection rates currently less than 10% and more than 22 billion gallons of total edible oil supply from select countries. [3-24]
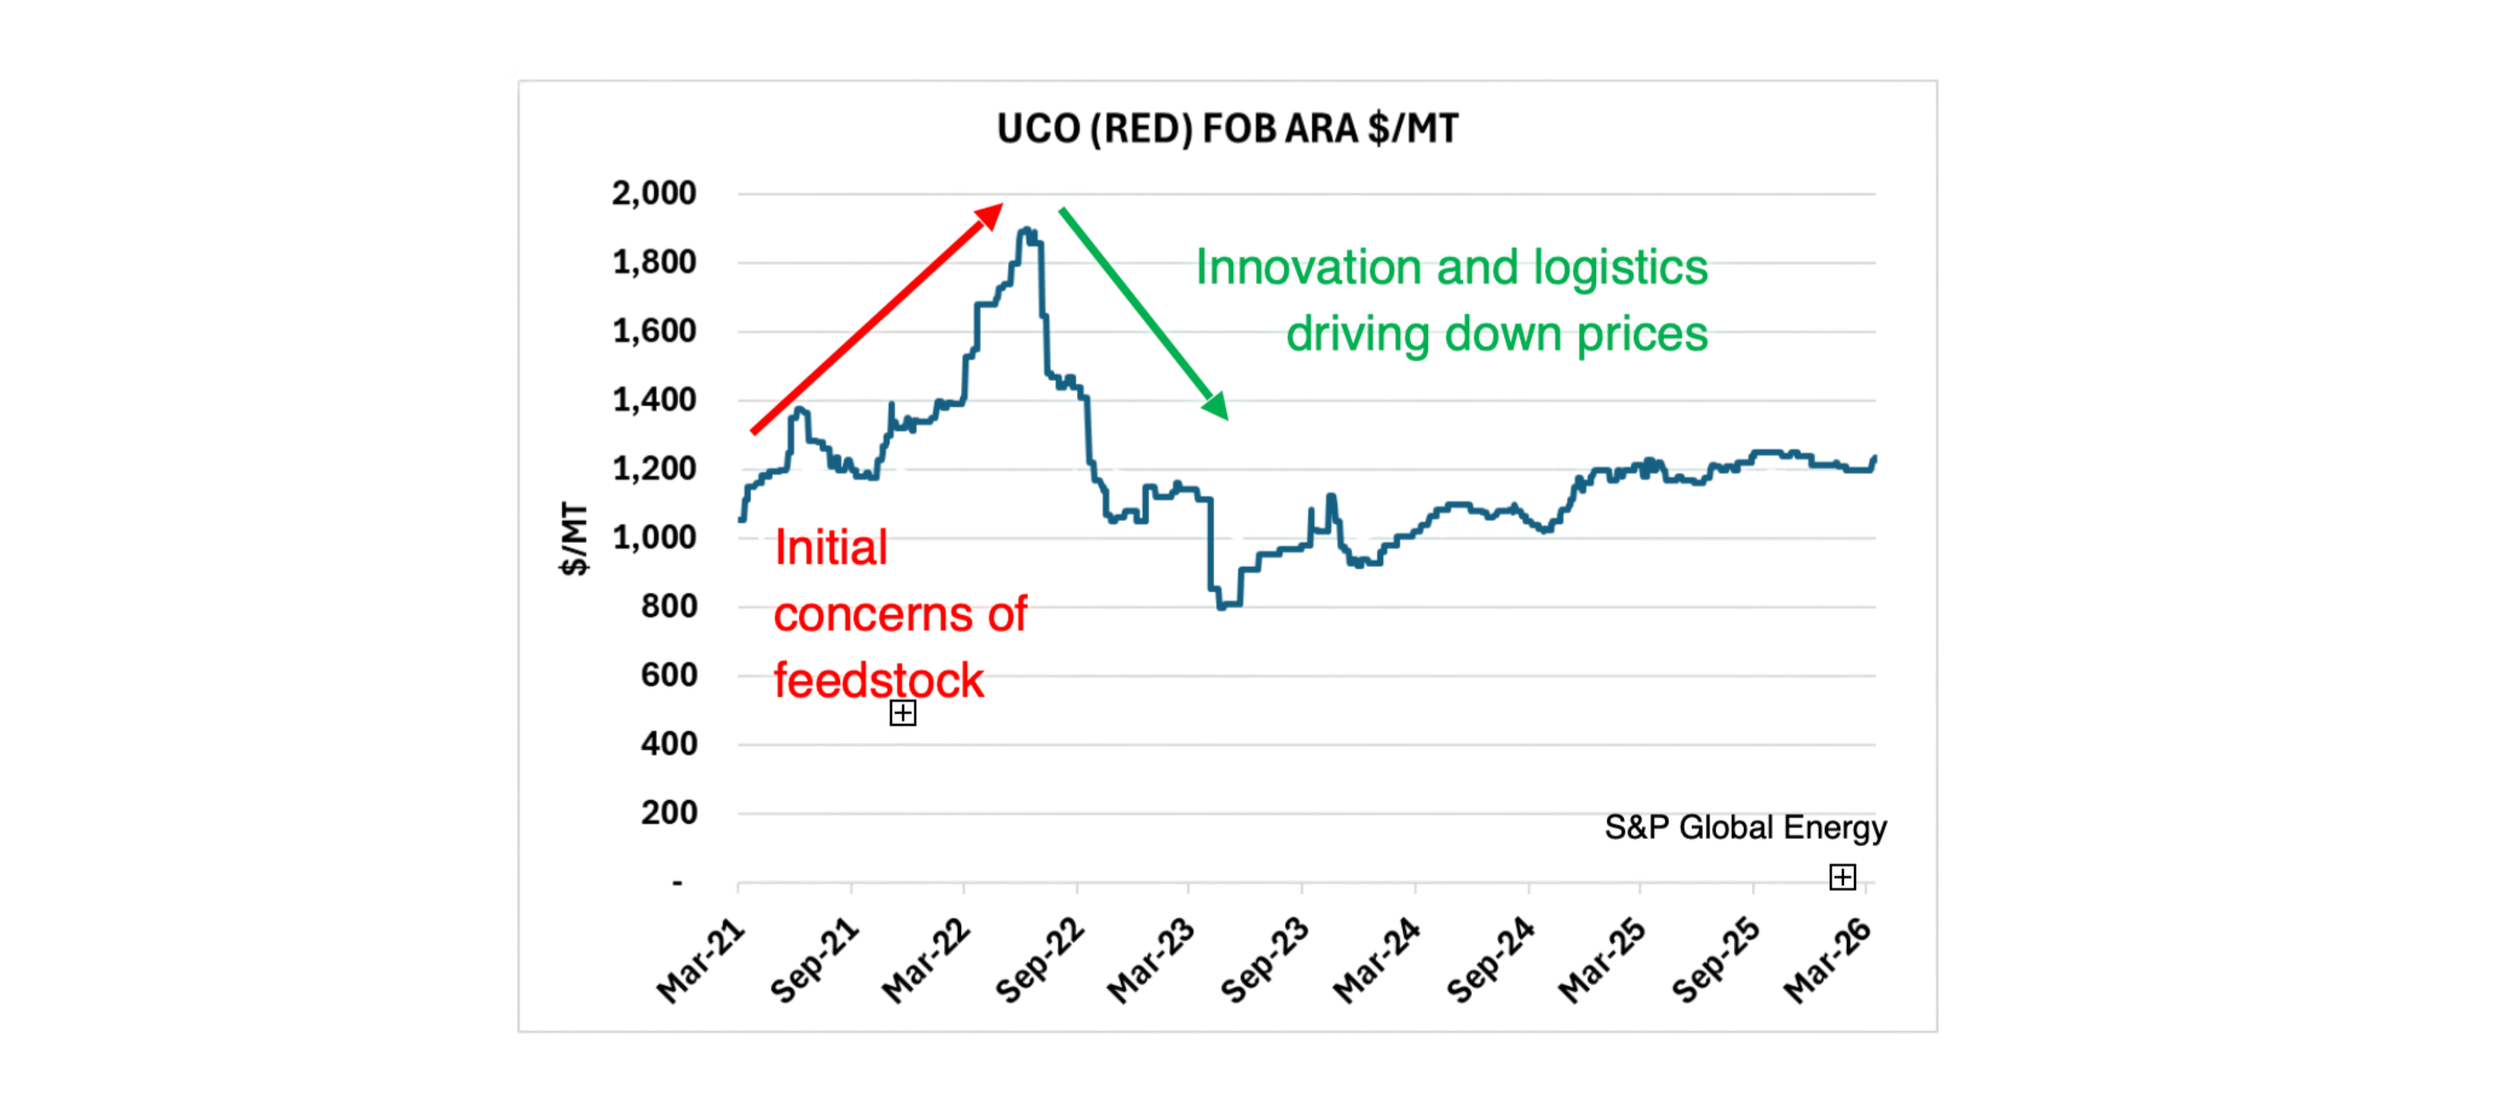
Used Cooking Oil (UCO) prices continue to decline as supply increases
Prices initially almost doubled due to speculations and concerns that there would not be enough feedstocks, however, subsequently supply of feedstocks responded to increased demand through process innovation and logisticsgrowth leading to prices returning to historic levels. [25]
References
GlobalData Agri. (2025, July). *Lipid Feedstock Outlook to 2030 & RVO Analysis*.
California Air Resources Board. (n.d.). *LCFS Quarterly Data Summary Spreadsheet*.
U.S. Energy Information Administration. (n.d.). *Feedstocks consumed for production of biofuels*.
Stillwater Associates. (n.d.). *Analysis of feedstock policy on U.S. renewable fuels production*.
Sudaryadi, et al. (2021). *Used Cooking Oil (UCO) Collection Model for Biodiesel Feedstock in Indonesia*. Traction Energy Asia.
China General Administration of Customs. (n.d.). *Statistics and monthly trade releases*.
CEIC Data. (n.d.). *China export time series database: edible vegetable oil*.
USDA Foreign Agricultural Service. (n.d.). *China UCO Trade Update*.
National Bureau of Statistics of China. (n.d.). *National data portal*.
Prasetiawan, T. (2022). *Pemanfaatan Jelantah di Tengah Carut Marut Tata Kelola Minyak Goreng*.
USDA Foreign Agricultural Service. (2025). *Biofuels Annual – India*.
USDA Foreign Agricultural Service. (n.d.). *Biofuels Annual – China*.
USDA Foreign Agricultural Service. (n.d.). *Biofuels Annual – Indonesia*.
USDA Foreign Agricultural Service. (n.d.). *Biofuels Annual – Indonesia* (alt).
USDA Foreign Agricultural Service. (2026). *Oilseeds and Products Annual – South Korea*.